
Get started
Orders and sales reporting in the portal
View, create, and update customer orders and analyse revenue trends with date-range filters, partner breakdowns, and CSV export in the CRM.
The Orders and Sales sections of the Heyzack CRM give you full visibility into your revenue pipeline. The Orders page lets you search and manage individual customer orders and update their fulfilment status. The Sales Report page gives you an analytics view with summary metrics, revenue and order-volume charts, and the ability to export the full dataset.
Orders
The Orders page shows every order returned by the sales report, filtered to the selected date range. Each order row in the table contains:
| Column | Description |
|---|---|
| Order # | Unique order number, prefixed with # |
| Customer email address linked to the order | |
| Lead Actions | Shows whether a lead exists for that email address; lets you view the lead, generate a portal token, or create a new lead directly |
| Address | Shipping or service address |
| Amount | Order total |
| Status | Fulfilled, Unfulfilled, or other status badge |
| Actions | Update button to change the order status |
The Lead Actions column automatically checks whether a lead record exists in the portal for each order's email address. If a lead is found you see a Lead Found badge and can click the lead ID to view it or generate a token. If no lead exists, a Create Lead button lets you open the create lead dialog pre-filled with the order's details.
Creating an order
You can create an order from two places:
- Dashboard — click the Create Order button in the top-right of the Recent Orders section.
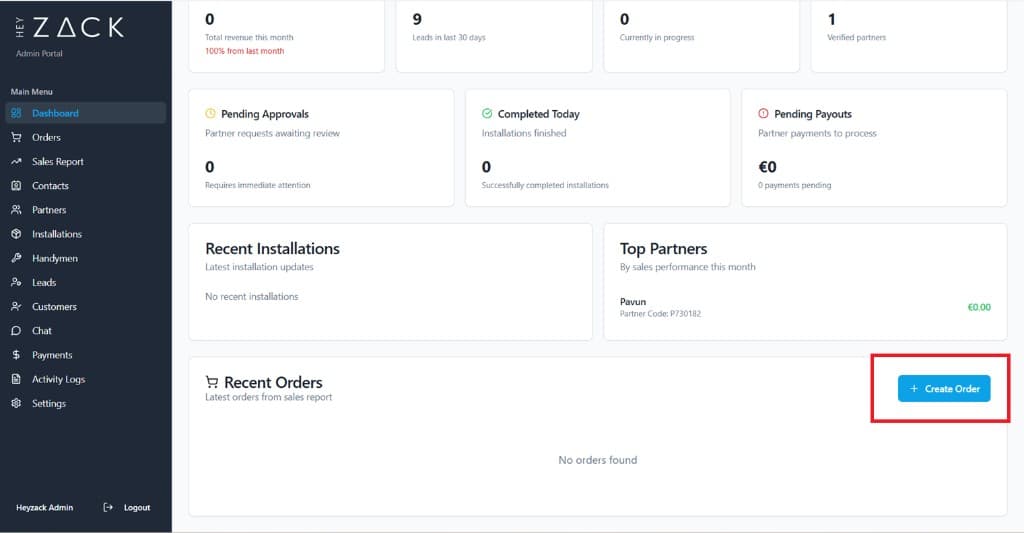
- Orders page — click the Create Order button in the top-right of the page header.

Both buttons open the same Create Order dialog where you enter the customer and order details.
Updating order status
Find the order
Use the search field to filter by email address, order number, or address, and locate the order you want to update.
Click Update
Click the Update button (pencil icon) in the Actions column of the order row.
Select the new status
In the Update Order Status dialog, select the appropriate status — for example Fulfilled or Unfulfilled — and confirm.
Sales Report
The Sales Report is accessed from the Sales section in the navigation. It displays four summary metrics at the top of the page:
Total Revenue
Aggregate revenue across all orders in the selected date range, with a growth percentage compared to the previous period.
Total Orders
The total number of orders placed during the selected period.
Fulfillments
The count of orders that have been fulfilled during the selected period.
Pending Orders
The number of orders currently in unfulfilled status that need action.
The report also includes two inline charts:
- Revenue Trend — a bar chart showing daily revenue over the last 7 days of the selected range, so you can spot the busiest days at a glance.
- Orders by Status — a breakdown of fulfilled, unfulfilled, and pending orders as percentages of the total, with a colour-coded progress bar for each.
- Order Volume & Revenue — a 7-day column chart showing the number of orders per day and the corresponding revenue total below each bar.
Filtering and exporting
The filter panel on both the Orders page and the Sales Report page gives you four controls:
Start Date
Set the beginning of the reporting window. The default is 30 days before today.
End Date
Set the end of the reporting window. The default is today.
Partner
Narrow results to orders attributed to a specific partner. Select All Partners to see the full picture.
Search (Orders page)
Filter the visible order rows by email address, order number, or delivery address.
On the Sales Report page, an additional Period selector lets you group time-series data by Daily, Weekly, or Monthly intervals.
To download the full dataset, click the Export CSV button in the top-right of the Sales Report page. The export respects whichever filters you have applied, so set your date range and partner filter before exporting.
Tip
Leave the default 30-day range in place when you open the Sales Report each week. A rolling 30-day view is wide enough to smooth out day-to-day noise while still showing meaningful trends — you'll quickly spot whether a dip is a one-off or part of a longer pattern.